Ask a question below and I will answer it tomorrow for you:
Public feed
The latest public Slice posts, articles and creator updates.


BTC / Gold Ratio Cycles
Current reading (Oct 2026): ~20.2 ounces of gold per 1 BTC (or ~0.63 kg of gold)
Key Observations
- Amplitude has increased — Early cycles bottomed near 3–5 oz; the 2024 peak reached 40 oz. The range has widened significantly since 2020.
- Roughly 3–4 year rhythm — Troughs in 2018–19 and 2022–23; peaks in 2021 and 2024–25. This loosely aligns with the Bitcoin halving cycle, though the ratio also reflects gold’s independent moves.
- Current position is mid-cycle — At ~20 oz, the ratio sits near its historical median (~10 oz) after the 2024 spike to 40 oz. It has roughly halved from the December 2024 peak.
- Gold’s recent strength — The decline from 40 oz to 20 oz since late 2024 reflects both BTC weakness and gold’s strong rally (1 kg gold rose from ~$80k toward $130k+).
Interpretation
The ratio tends to expand sharply during risk-on BTC bull phases and compress when gold is preferred (risk-off or inflation-hedge demand). The current ~20 oz level is neither extreme nor cheap by

Bitcoin vs 1 kilo of Gold - 5 years chart
As of October 21, 2026, 1 Bitcoin (~$83,000) buys roughly 0.63 kg of gold, while 1 kg of gold (~$132,600) costs about 1.6 BTC.Current approximate prices:
- Bitcoin: ~$82,800–$83,100
- Gold: ~$4,120 per troy ounce → 1 kg ≈ $132,500–$133,000 (using 32.15 troy oz/kg)
This means 1 BTC ≈ 20.1 ounces of gold (or ~0.63 kg). The BTC/gold ratio (ounces per BTC) peaked near 40 ounces in December 2024 and has roughly halved since, as gold strongly outperformed in 2025 while Bitcoin lagged after its ~$126k ATH in October 2025
- 2024–2025: BTC/gold ratio hit a cycle high (~40 oz/BTC) around the December 2024 peak. Gold then dominated 2025 (~+60–70% YTD, driven by central-bank buying, ETF inflows, and macro uncertainty), while BTC was roughly flat-to-down after its October 2025 ATH. The ratio fell ~50% to the ~20 oz range.
- Recent (2026): Both have been relatively flat-to-soft YTD. BTC remains far more volatile; gold has acted more like a traditional store of value in th


Long-term Gasoline Cycles
• The three dominant cycles indicate pricing pressures into 2028, then easing of pressure into the early 2030s.
• This outlook aligns with the inflation indicator cycles I posted a couple of times.

Where are Gasoline Prices Headed?
• Everyone is interested in gasoline prices and their impact on inflation.
• The two dominant cycles of gasoline futures indicate a pullback into Nov-Dec’26, then up into Spring of 2027.

EURUSD Cycles
It looks like multiple cycles troughed, so maybe a multi-month bounce may be in play.

NASDAQ 100 Technical Analysis – A Follow-Up
• After a deep oversold condition on Friday, NDX attempted to bounce but could not overcome the 50D and 100D MAs.
• Initial strength on Monday and Tuesday was met by afternoon selling, which produced two consecutive spinning top candlesticks, signifying indecision, i.e., a battle between bulls and bears.
• NDX remains stuck inside the ugly Friday’s candle and between the lower Keltner channel and 50D and 100D MAs.
• It needs to show another card, i.e., break the range.
• Somewhat surprisingly, the NDX/VXN ratio has not been able to bounce even to the lower Keltner channel.

Market Breadth
Remarkable market breadth on Tuesday lifted the broader market, including the Dow Jones and Russell 2000.
Even the NASDAQ had positive breadth despite finishing slightly lower, held back by most semiconductor and Magnificent 7 stocks.
Rotation again, for a day or two?

ETF ZROZ vs ETF HYG - 3 months chart
Chart and price context
ZROZ (PIMCO 25+ Year Zero Coupon U.S. Treasury Index ETF) tracks ultra-long STRIPS with an effective duration around 25–27 years. That makes it an amplified pure play on long-end yields. On the 1-hour chart we shared, the blue line shows a clear acceleration higher after the early-October low (near ~$52 around October 7), with a vertical spike that breaks the immediate downtrend channel and recent consolidation. That qualifies as a short-term technical breakout/bounce from the recent swing low.
Supporting price action:
- Low near $51.97 on Oct 7.
- Rally through the mid-50s, with a strong session around Oct 15 pushing it near $57, then settling in the mid-to-high $56s.
- This lines up with the 30-year Treasury yield peaking near ~5.67% in early October and pulling back toward the mid-5.40s.
HYG (high-yield corporates) has been far more range-bound and slightly softer in the mid-to-high $76s, which is consistent with its much lower duratio

“FRANCE'S DEBT HEADACHE COULD SEND THE EURO BELOW $1.10 Raiffeisen Research warns that France's worsening fiscal outlook could push EUR/USD below $1.10. The euro trades near $1.1218, after hitting a 17-month low of $1.1112 last week. The key takeaway: France's fiscal troubles” - Bloomberg
During the European sovereign debt crisis (primarily 2010–2012, centered on the PIIGS: Portugal, Ireland, Italy, Greece, Spain), the euro depreciated meaningfully against the USD amid rising break-up fears, contagion risks, and sovereign stress.
Historical EUR/USD Behavior
- 2010: Opened near ~1.43–1.45 and fell sharply to a low around 1.19 (June, amid the Greek crisis escalation). Year average ~1.33; closed near 1.34. This reflected early contagion fears.
- 2011: Peaked near ~1.49 (May) before declining toward ~1.29 by year-end as Italian and Spanish spreads widened and political/fiscal uncertainty intensified. Average ~1.39; closed ~1.29–1.30.
- 2012: High near ~1.35 early in the year; low around 1.21 in July

The previous gray count is back


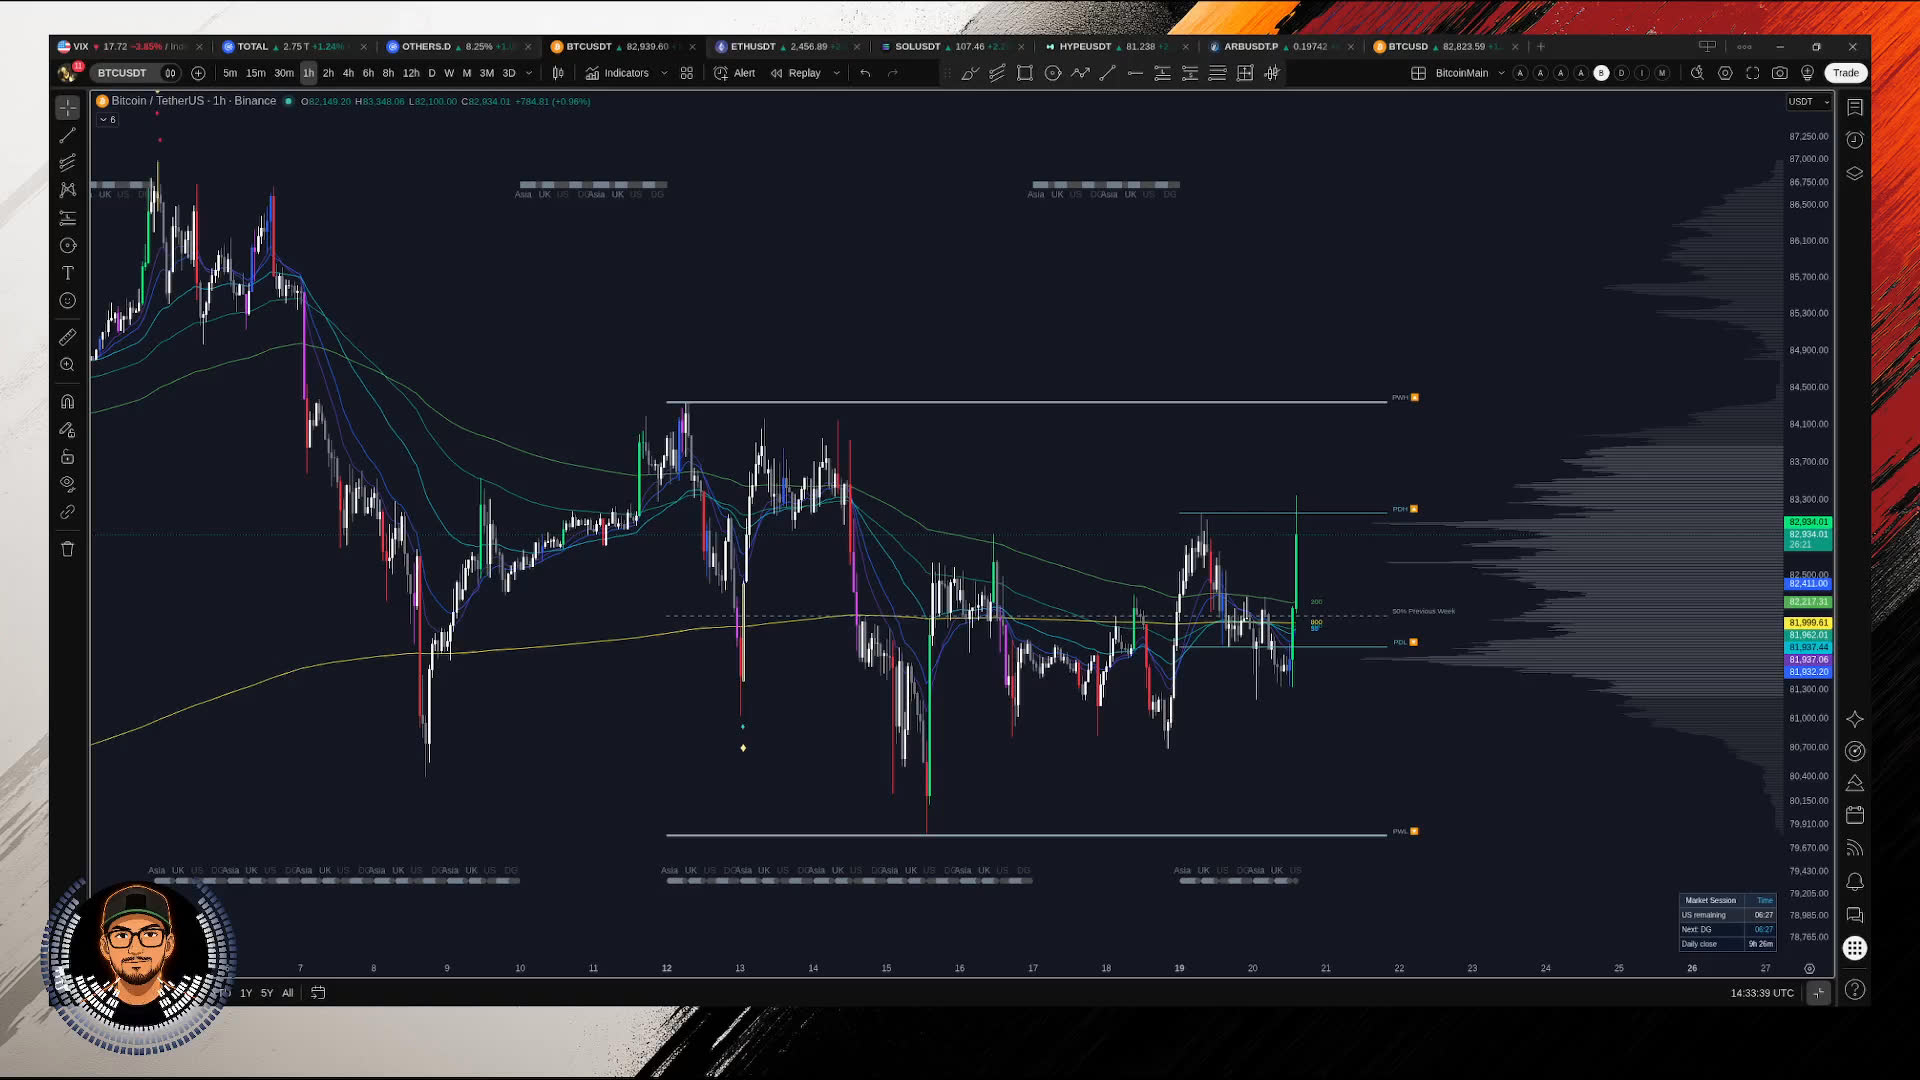

USDJPY 12H BB LOOKS READY TO EXPAND TO THE DOWNSIDE




Wish you all a Very Happy Dusshera!