IncomeSharks
Private Post
Get access to all contentUnlock private posts and exclusive community discussions.Sign up

Crypto and stock trader focused on fundamental analysis, trend analysis, and swing trading.

Joined on 13th October 2025
Two Shark Indicators Video Walk Through
Video going through both indicators. Please do not hesitate to ask questions, even if it sounds like a dumb question. The more feedback and information I can get the more polished of a guide I can make.
Sharks Stock Trader
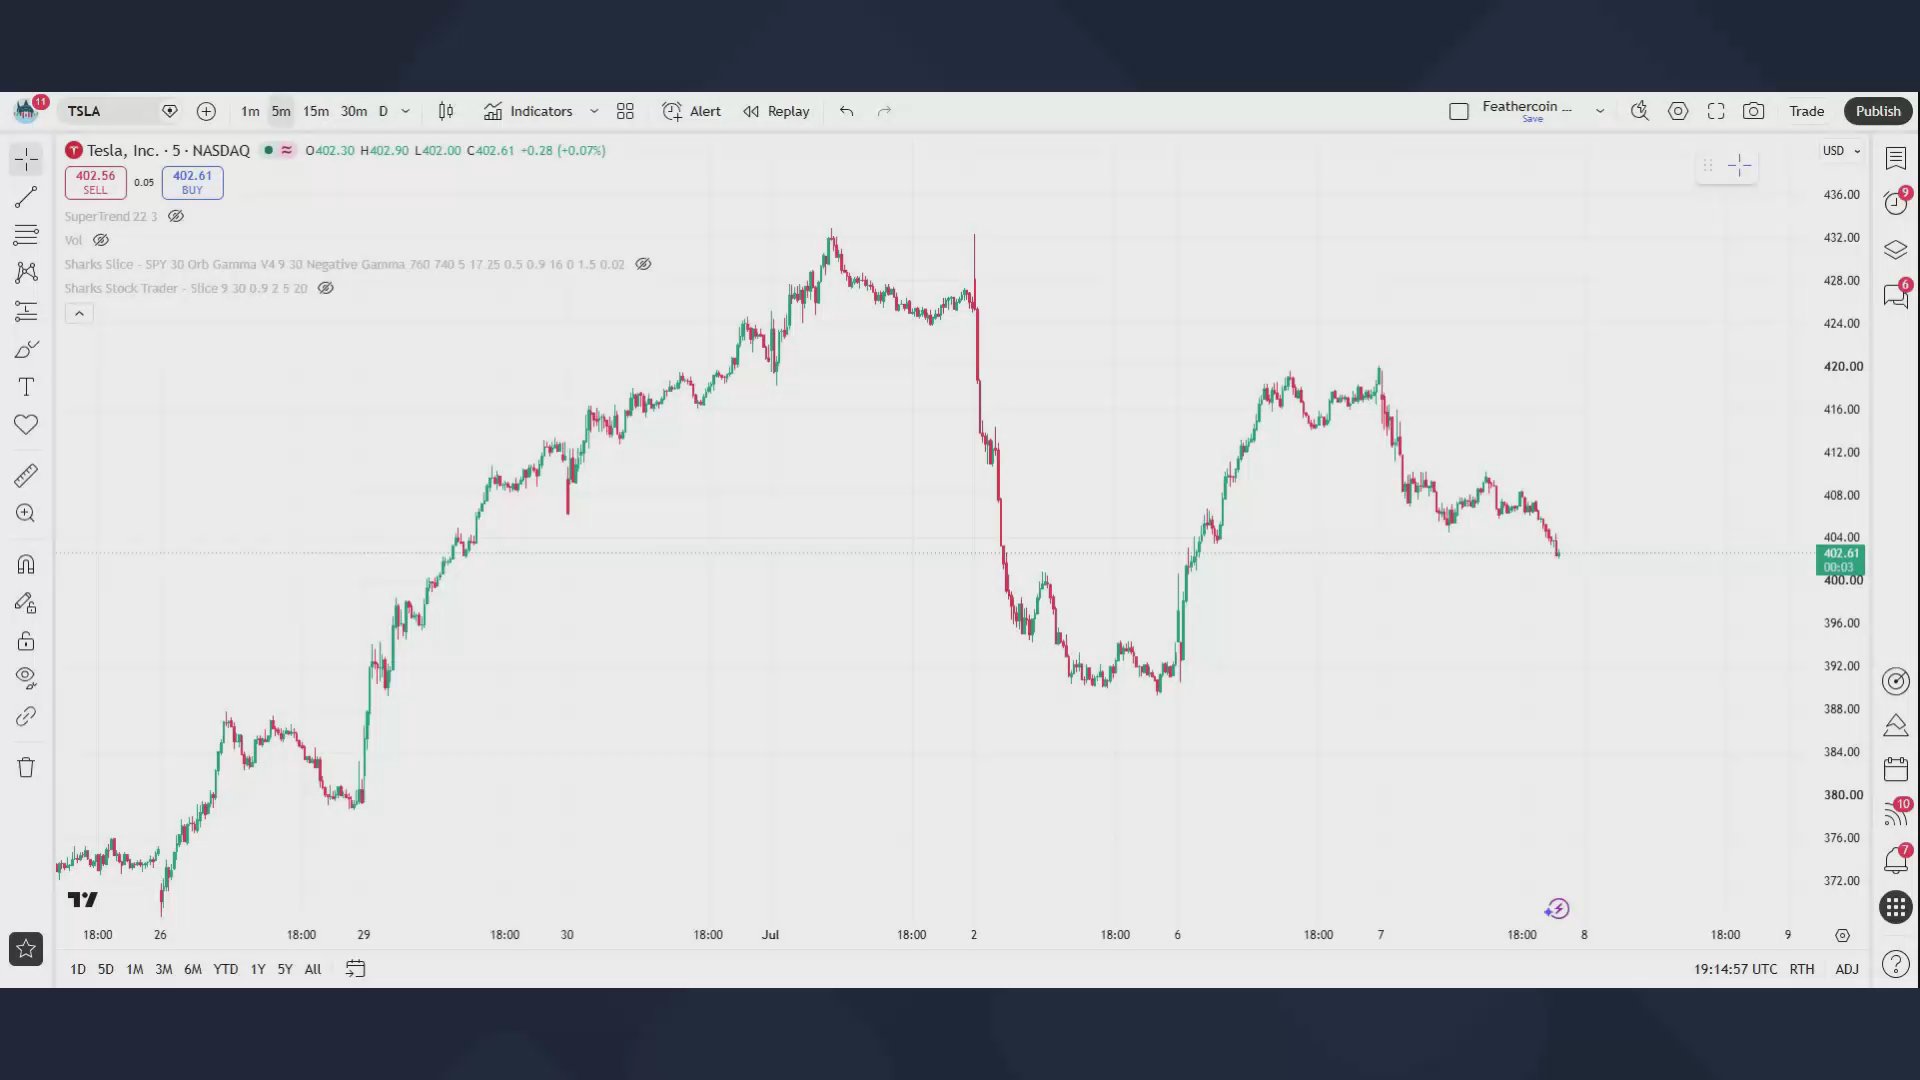
This one has been doing really well for individual stocks. It's actually even done a better job the past few days than the SPY trader just because of the dynamic price targets. Right now TSLA seems to be the best stock to use it on as it's 8/8 on signals with no confusion and clear price entries and exits. Makes me confident that it could actually be used for agentic trading but I'd love to get some data on some bad days to make it better but so far haven't seen it yet.
Sharks Slice SPY 30
I will be adding the OR targets with a dotted line as well as putting the dotted lines on the charts when the signal fires. This way you know where the Shark and Whale targets are hiding (or maybe you want them disabled so you don't know but you c

New Custom DayTrading Indicator
First goal was to build out a day trading indicator that uses the 30 minute range. Next goal will be to automate via AI agents and be able to connect to Robinhood for completely hands off trading.
Next Step: OBV related Swing trade Indicator
The next thing I'll be playing with is adding on top of the OBV indicator and combining SuperTrend and a 20 day MA to give higher confidence swing trade signals on the 4h and 1 day charts. Higher time frames won't be as important for automating the system but I'd like to also connect it to a bunch of alerts and be able to wait for BUY signals to fire off on the watchlist to get more eyes on charts.
Day Trading 30 Indicator
It's meant to be used on the 5 minute chart. The more consecutive dots, the more confidence in the signal. Dollar signs being printed are when 1x, 1.5x, or 2x the implied volatility range gets hit. It's a signal that can be taken as soon as printed. Invalidation can come when the dots stop showing up.
It