Feed
Feed

Public feed

The latest public Slice posts, articles and creator updates.

$USAR and $INTC the top two performers on the entire watchlist over 30 days.


80% and 106%

Both were US government investments. $INTC originally shared below $20 for 2 entries before slice, $USAR mentioned 20 times since having slice.


There's a lot of FOMO on $INTC but hammering DCA's even more on $USAR would have been very similar results.


Hindsight is a traders worst enemy

In a perfect world I would have held $INTC from $20 and hammered 50% of the portfolio into $USAR at the lows. Perfection does not exist in trading and I'm happy to have covered both of these stocks below $20, pushed for them when prices were flat and down, and I'm hoping to be able to do a victory lap of $USAR at $40 and in the future when it's at $80 be made fun of for selling too early.

I'm excited for the next big play, long overdue to get a big runner on Slice


The latest FX Weekly Signals point to a more selective backdrop. DM remains modestly positive (+0.05), while EM has slipped back to roughly flat (-0.01).


In G10, GBP (+0.50) and EUR (+0.40) continue to lead. GBP is being supported mainly by fair value and carry, while EUR is driven by fair value and regime, with carry still a drag. SEK (+0.38) also stands out as a broad-based positive. On the other side, AUD (-0.47) is now the weakest developed-market signal, with trend and fair value the main headwinds, while JPY (-0.27) remains soft and CAD is essentially neutral.


In EM, INR (+0.64) remains the clearest positive signal, with strength across almost all components, and ZAR (+0.35) is also constructive. CNY (-0.46) and BRL (-0.39) remain the weakest signals, while KRW (-0.26) has also turned more negative as poor carry and liquidity outweigh better regime and valuation inputs.

Top performers of Nuclear Theme stocks discussed earlier in respective segment:


-NTPC: 25% (Large cap)

-Thermax: 43% (Mid cap)

-MTAR: 150% (Small cap)

-Patels Airtemp: 30% (Micro cap)


Quick Summary of AMZN, GOOGL, META, and MSFT Earning Releases

Alphabet (GOOGL)Strong beat on both top and bottom lines.
Revenue ~$109.9B (beat estimates), driven by resilient advertising and accelerating Google Cloud growth.
Heavy AI spending continued (capex guidance significantly higher).

Amazon (AMZN)Solid beat: Revenue ~$181.5B, EPS $2.78 (well above ~$1.62 consensus).
AWS growth remained robust with strong AI infrastructure demand, though margins and capex were key focus areas.

Meta Platforms (META)Big beat: Revenue $56.3B, EPS $10.44 (vs ~$8.15 expected).
Advertising business very strong, but raised full-year capex guidance sharply due to AI infrastructure buildout.

Microsoft (MSFT)Beat expectations with solid Azure and Cloud growth.
AI-related demand (Copilot, Azure AI) was a major positive, though capex remains elevated.

Overall Theme: All four companies posted strong beats, driven by resilient advertising and accelerating AI/Cloud demand. However, massive AI-related capex remains the do

... see more

BoJ and USDJPY

BOJ holds rates at 0.75% (6-3 split).

- 3 members pushed for a hike.

- Core inflation forecast raised to 2.8%, growth cut to 0.5%.

- Ueda stays cautious, hawkish undertone.

- Yen jumps, then fades. Nikkei -1%.

- Markets eye June hike.

- Hawkish hold puts pressure on yen.


USDJPY is approaching our target, it should be a nice short opportunity.


Semiconductor's Valuations

  • Semiconductor's market cap has never been so extended, fwiw.
  • It is twice of the one at the 2000 dot-com peak. It will come down eventually, the question is of precise timing. See my SMH cycle chart posted a few days ago.


Sell in May and Go Away

  • Retire "Sell in May and Go Away?" I am not so sure, especially not this year
  • Maybe shift May to June?


Gold Cycles

  • Earlier this year, cycles detected the gold peak to the day.
  • There was no much change. The four dominant cycles point to a cycle trough in July.


SPX - Cycle Analysis Part 2

  • When we combine the four long cycles with four very long cycles I previously detected on the weekly chart, we get the cycle composite below.
  • Notice that the cycle peak with this combination is shifted to the first half of June.
  • I mentioned this left-translation of the daily cycle composite due to longer cycles multiple times, but now I have the capability to combine all these cycles and prove this left-translation.


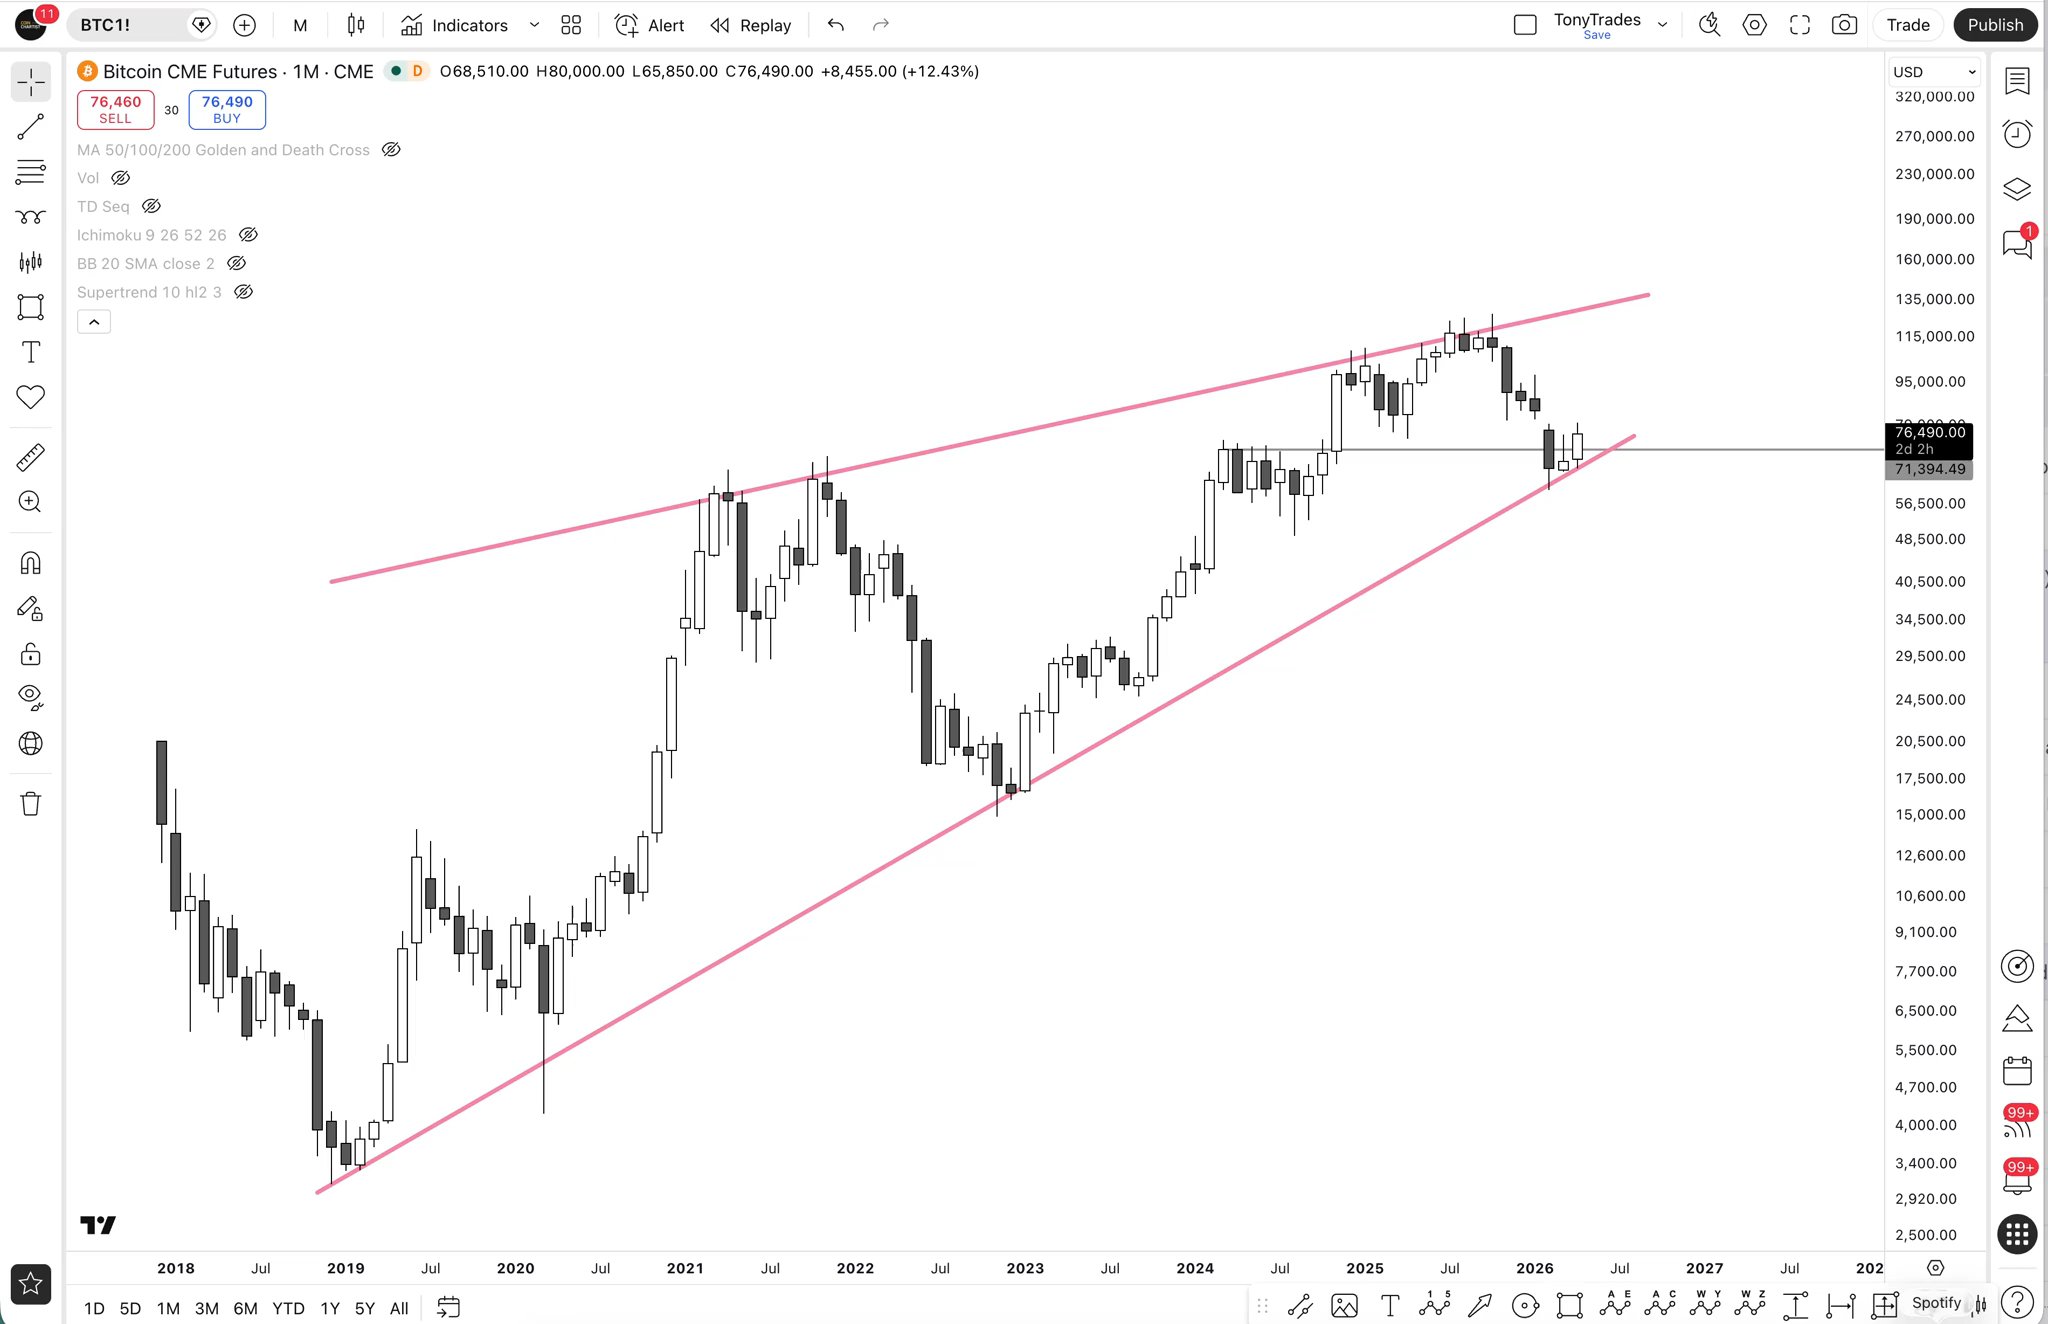
Bitcoin BTC CME Monthly Candlestick And Trend Line Analysis: Interesting Take


In this video, I take a trend line and move it around to show a couple different versions of a pattern - one that's bullish and suggests a bottom and a possible move up, and another that's a bearish retest


I also cover the monthly Morning Star and what levels would need the monthly to close above or below to be bullish or bearish.