Public feed
The latest public Slice posts, articles and creator updates.



US food price inflation is shocking:


Unified Data Tech solutions is now 51% up in last 45 days
Market cap up from 580cr to 870cr+


Silver (SI) Cycles


First Chart Club breakdown is live.
Bitcoin structure, momentum, and the key levels currently shaping price action.

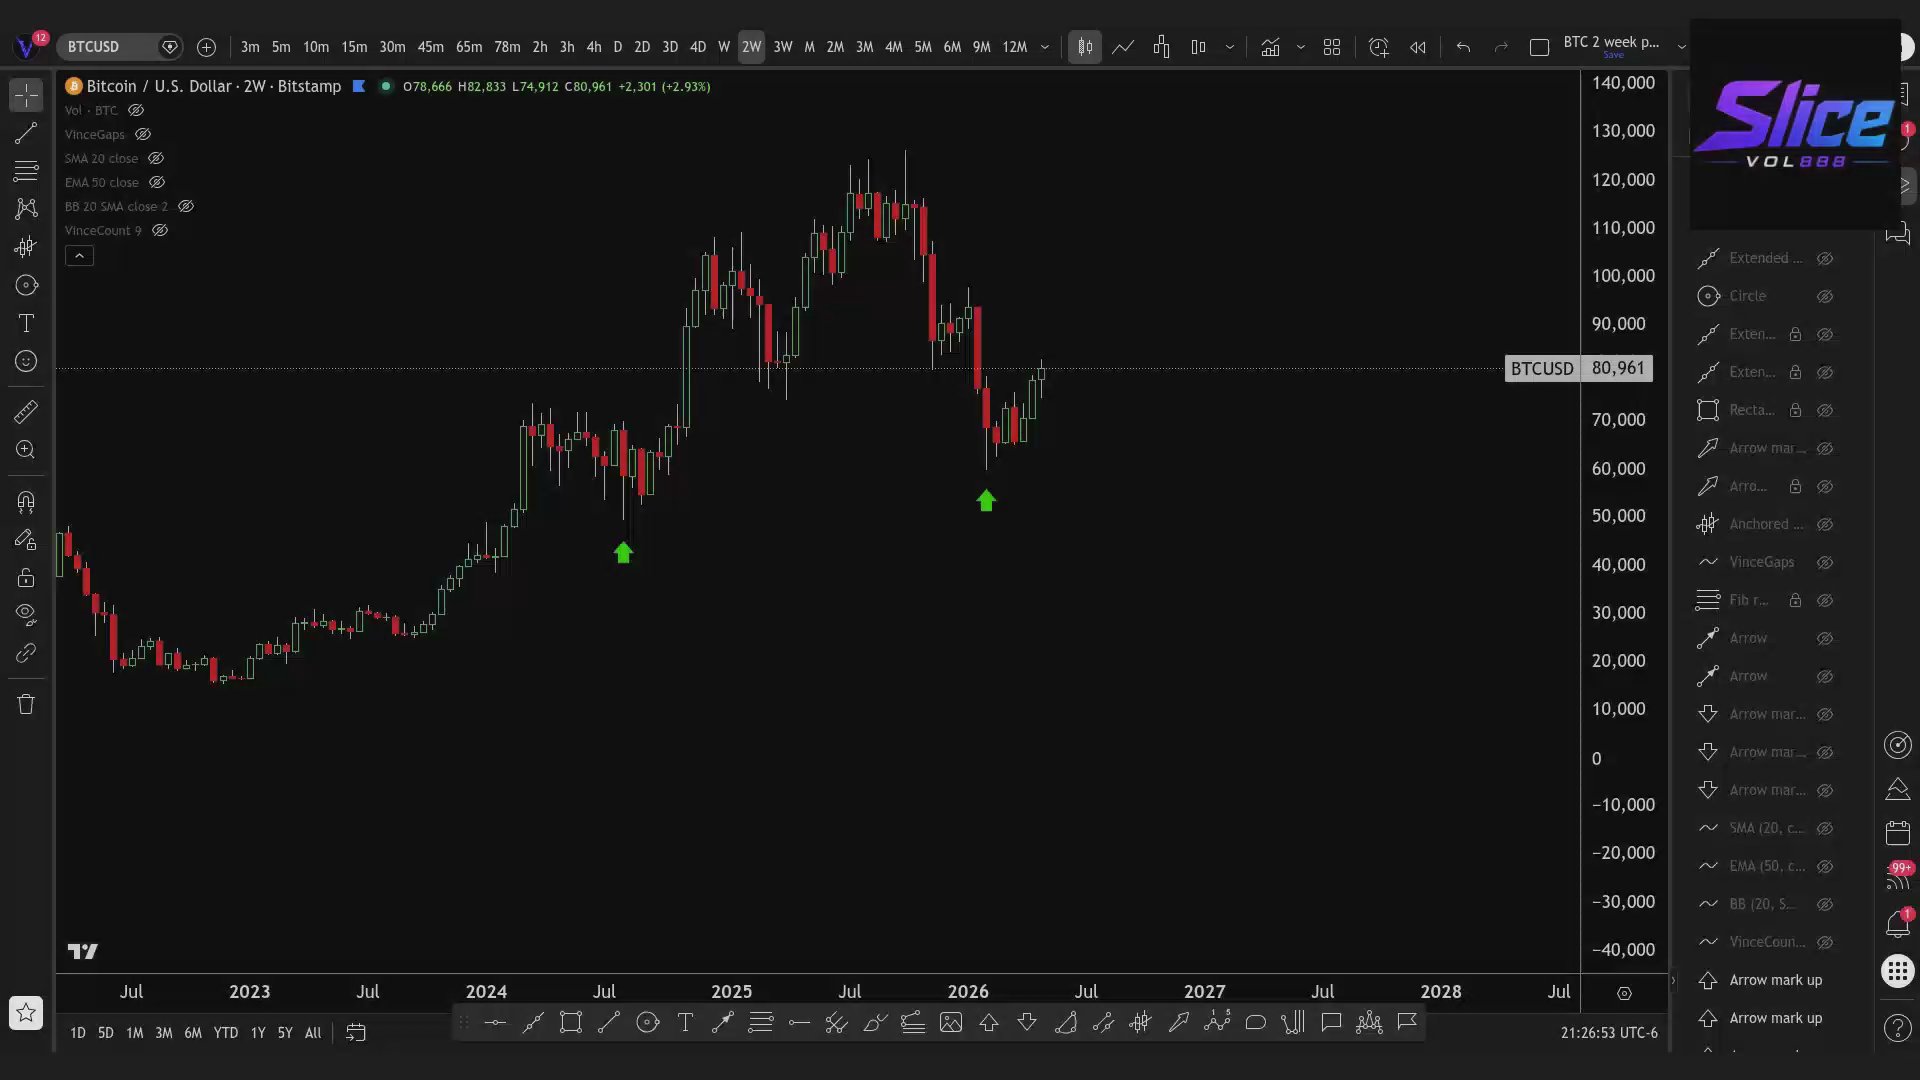
Chart Club on Slice officially launches this weekend.
The focus here is simple: structured market breakdowns centered around momentum, risk/reward, and the levels that matter most.
First analysis coming soon.
Saudi Arabia’s sovereign wealth fund in now operating a second office in mainland China.
The pieces of the global puzzle continue to unfold. This is a reaction to events in Iran and the wider West Asia.
This is real globalisation:
China has agreed to end all tariffs with 53/54 African nations and people are being lead to believe that globalisation is over.
In terms of the Global South it has barely started.

Bitcoin Zig-Zag Elliott Wave Count and Cyclical Timing: Bearish Wave Count
This is more of a reminder about this chart and the potential around it. I will provide a bullish alternative count after this. I am going to share the bear count on X, but the bullish count is exclusive here. I talked about the bearish version on Market Talk, so I want to share it so the other analysts on the panel can critique the work
We know that we aren't in an expanded flat anymore. That is ruled out. So this is the most likely bearish count
This is specifically counted out to follow the overall cyclical rhythm. This method has been extremely effective for me for several years now
As you can see, price is still following it well. If it continues to do so, this is the best "look" and fit per Elliott Wave Principle
I did study on X waves, and these are the target highs:
38.2% $85,212
50% $93,000
61.8% $100,788

EURUSD
- Euro is behaving as anticipated as per the preferred EW count.


Quick read on where we sit heading into a fresh week.
Momentum is still strong across the board. We're pushing back toward the highs we saw on April 17th. The S&P, Nasdaq, and Russell are all aligned. On the surface, that should feel great.
The problem is what's underneath.
Tech is doing all the work. Industrials, utilities, defensives are flat. The TECL is overbought. The SOXL is overbought. Intel's RSI is at 87 with overbought normally considered 70. We've got a handful of semis doing 60% to 100% in a month while the rest of the market quietly trades sideways or slips. That's not a broad rally. That's a single industry pulling the index higher while everything else holds the line.
Goldman is now openly calling for a 3% to 5% flush. (That's your first sign to be long.)
Mechanical institutional selling was around $10 billion last week. Retail is buying every dip. So you've got the smart money lightening up while the dip buyers fund the rally. That's a setup that historically resolves one wa


SHORT CL - IT HAS PARABOLIC STRUCTURE WITH A SERIES OF NEST 1-2s
Bought 100%
CL
Crude Oil
4 May
SHORTInvested Capital
4.7%
Selling Price
100.6$
Buying Price
106.1$
ROI
-5.45%


All Roads lead to BlackRock
Could BlackRock be on the verge of an earnings acceleration and a move to $1,700/share by 2030?


Watching the stablecoin dominance chart (USDT.D+USDC.D) this weekend to see if we get that move lower that we have been waiting for - a sweep of the lows could setup a beautiful opportunity to short BTC and crypto.
A sweep of the lows would be a move into the golden pocket fib and also a sweep of the previous week lows.
We do need to be cautious though... if we don't get just a sweep and immediate move back above the lows and into the existing range, there is the possibility that we could still be seeing stablecoin dominance head into that grey zone marked on the chart - which would mean that BTC could actually be putting in another leg higher towards mid to high 80s potentially.
The grey zone makes a lot of sense on the weekly chart but we aren't guaranteed to get a perfect move into it.


EURUSD Cycle Price Targets
- EURUSD has a 20D (not shown) and 40D (below) cycle targets that largely overlap.
- The sharp reversal on Friday gives credence to these targets.
