TonyTheBullSeverino
Private Post
Get access to all contentUnlock private posts and exclusive community discussions.Sign up

Chartered Market Technician. Cycles, crowds, psychology. I don’t predict — I observe structure. Less noise. More signal.

Joined on 15th November 2024

Boston, MA

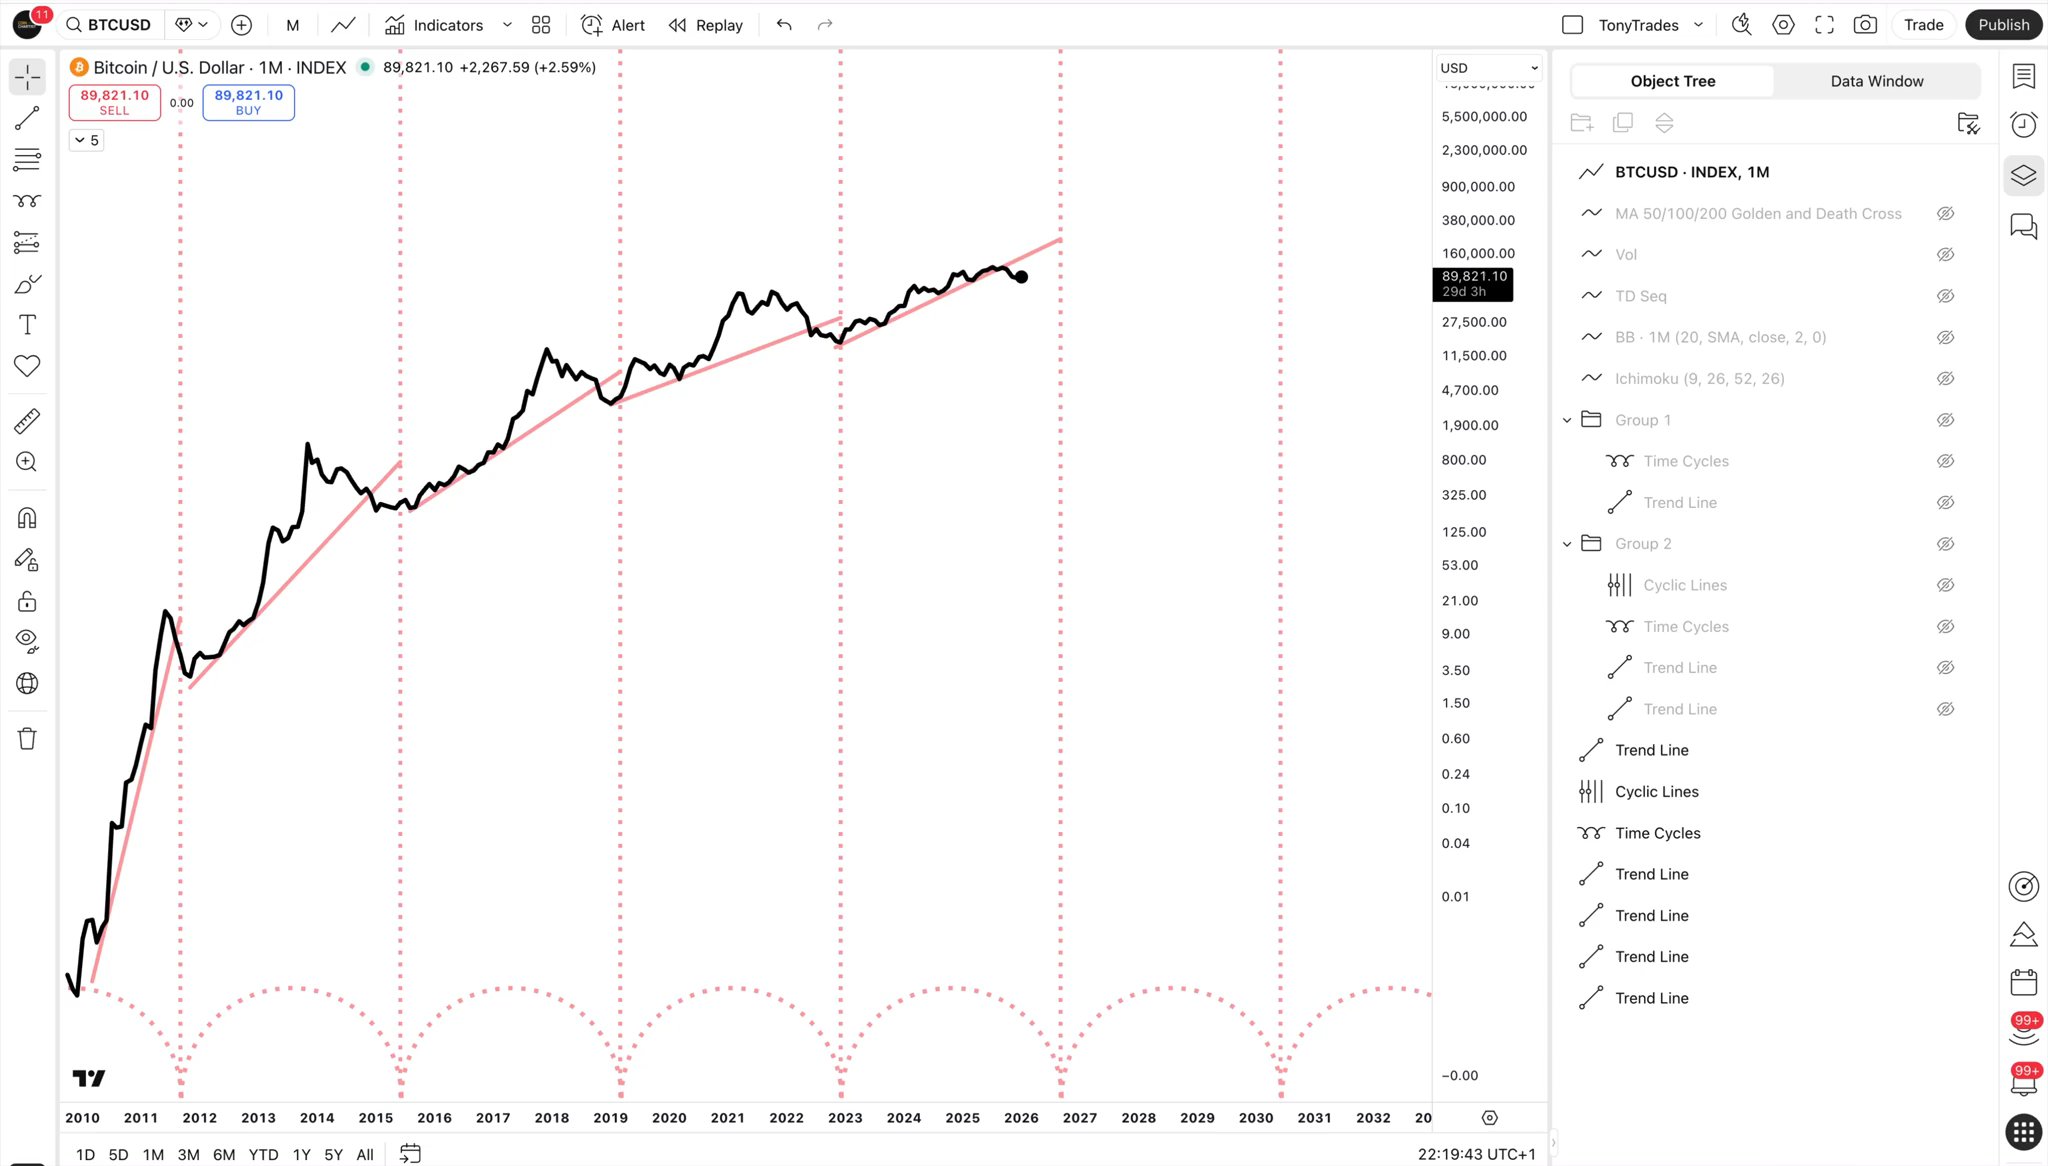
I posted three charts today on X regarding Bitcoin's different cycles across 4-years, 8-years, and 16-years.
This video ties it all together, fully explains Hurst Cycle Theory and how to apply it, and what it applied to Bitcoin might suggest for the cryptocurrency's future.
It also explains the theory's core principles and what to expect as the cycle reaches its amplitude.
Thanks for watching. Feel free to ask any questions.
Hurst Cycle Theory is a revolutionary approach to understanding the financial markets. Developed by J.M. Hurst in the 1960s, it remains a cornerstone of technical analysis. It’s anchored on the premise that markets move in cyclical patterns. These cycles, though seemingly random, carry underlying patterns that a discerning eye can decipher.
The foundation of Hurst Cycle Theory lies in the analysis of these patterns. It uses a complex yet efficient method to reveal the rep


Technically, BTCUSD's daily Bollinger Bands are tightening, highlighting diminished volatility. This tends to precede a switch to volatility and confirmation versus ranging and uncertainty.
Simply put. When the calm breaks, a big (daily timeframe) move comes
Based on where the market is, there is a higher probability the market moves up in the short term. This is due to the psychology at play – and its a ripe setup for a bull trap
BTCUSD momentum is already aimed towards fear and panic, not hope and optimism. The problem is that the market hasn't yet accepted this change
The last big move down that got us to this current range was nasty, but not quite enough to get everyone to believe it is a bear market - this means the trend is lacking acceptance
Because there is a lack of acceptance, bulls will easily believe their biases were correct and confirmed when price moves back up. Their complacency makes them an easy target for t

We’ve got three charts here.
First, we have ONDO which shows a Head and Shoulders top pattern mid breakdown. Target is 20 cents
Second, we have OTHERS that shows the same pattern pre-breakdown. This could suggest altcoins as a whole have another 50-60% leg down coming
Third, we have a cyclical look at OTHERS, which shows that a bear market is right on time, and should bottom in mid-2026
RSI will reach oversold before the bottom is in
Be careful with alts