TonyTheBullSeverino
Private Post
Get access to all contentUnlock private posts and exclusive community discussions.Sign up

Chartered Market Technician. Cycles, crowds, psychology. I don’t predict — I observe structure. Less noise. More signal.

Joined on 15th November 2024

Boston, MA

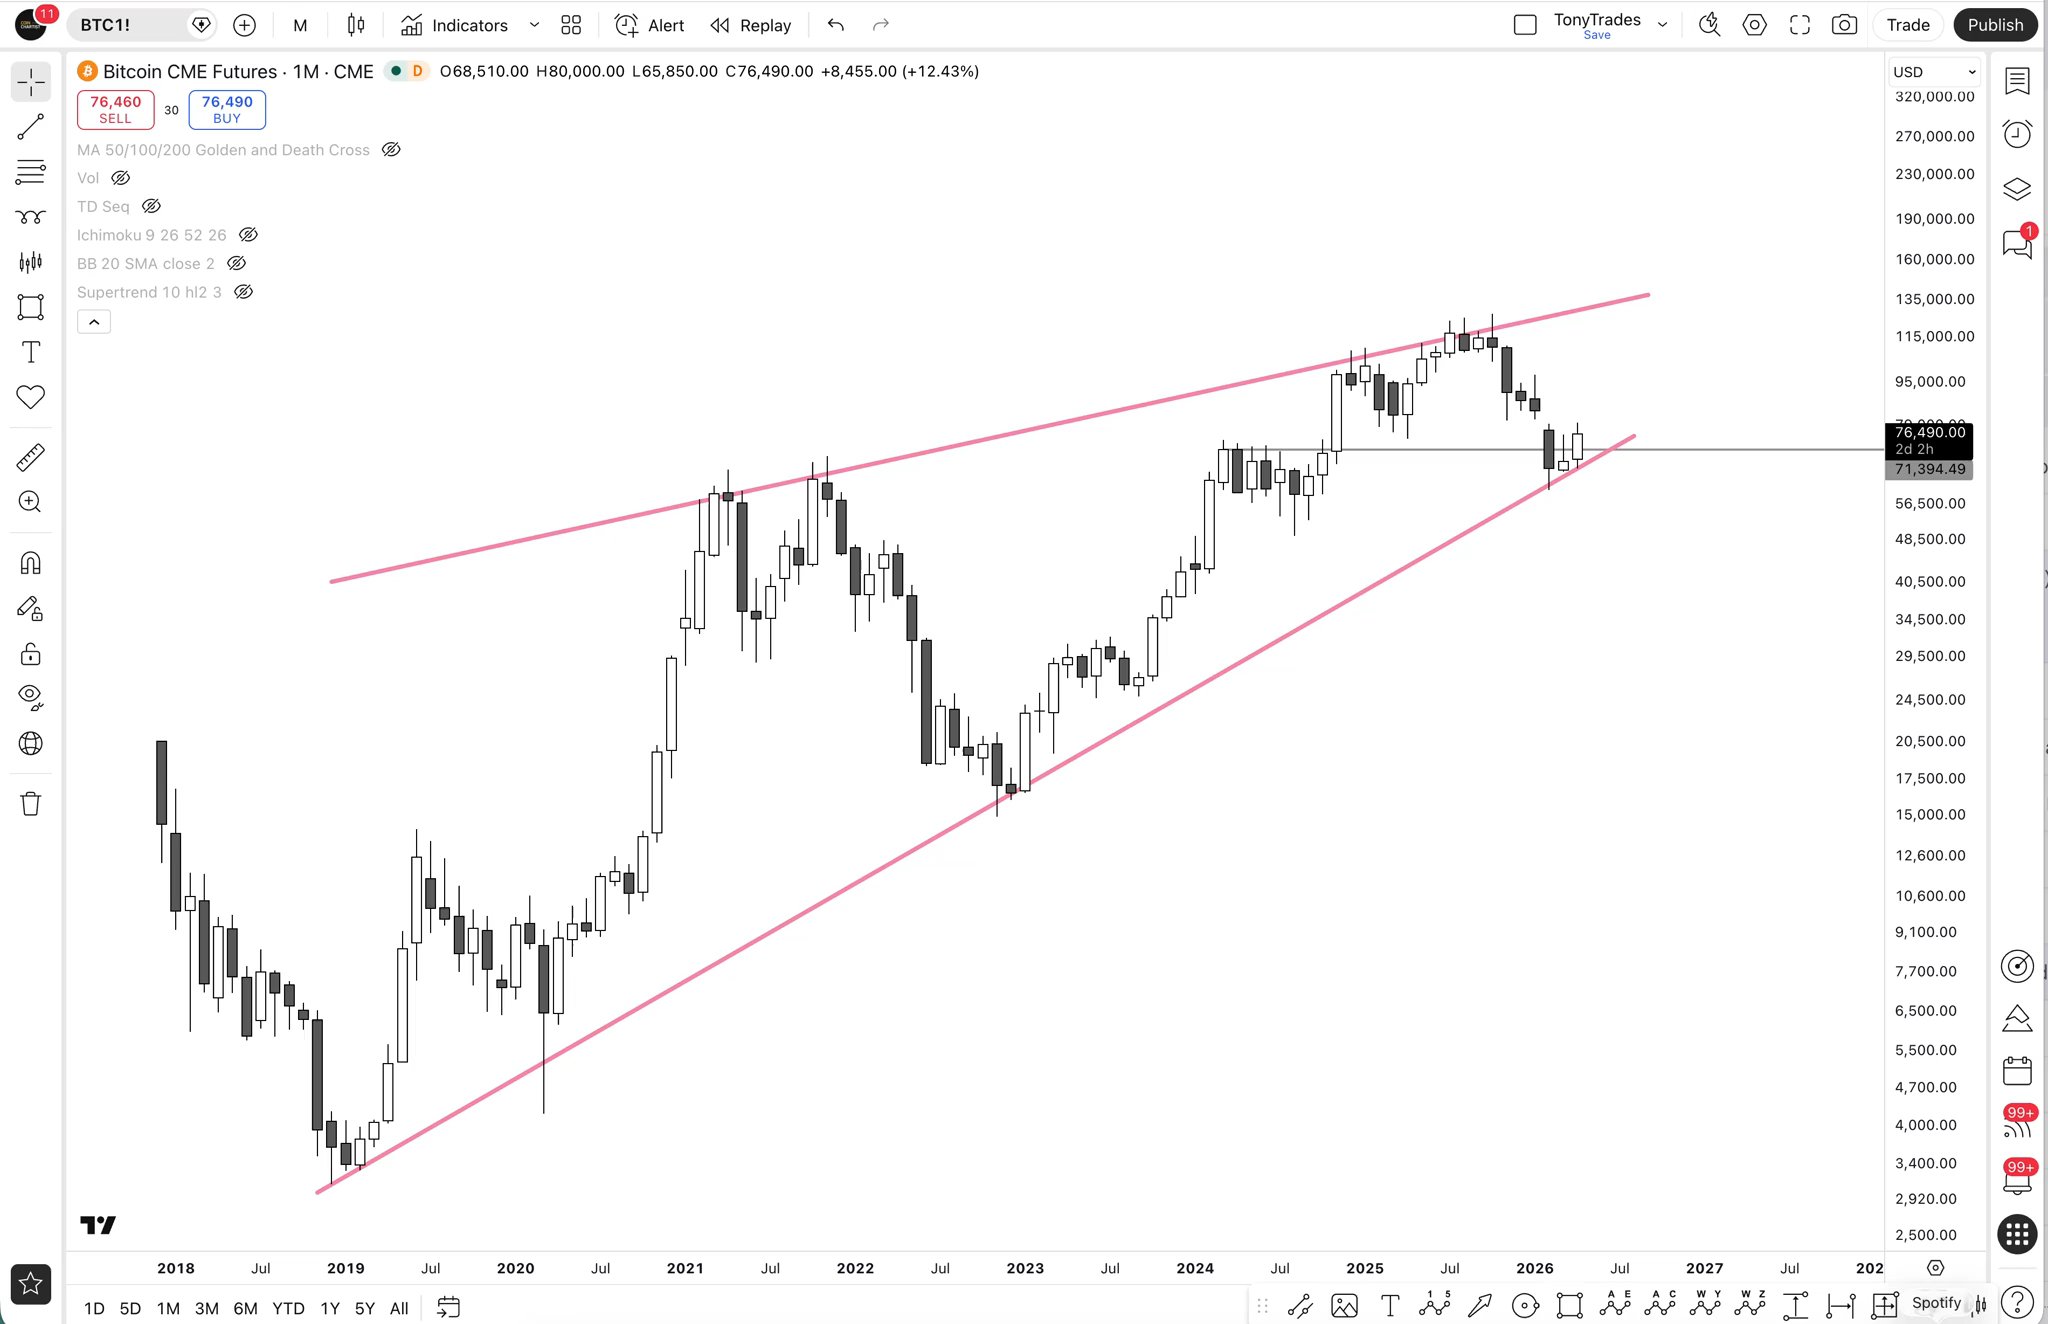
In this video, I take a trend line and move it around to show a couple different versions of a pattern - one that's bullish and suggests a bottom and a possible move up, and another that's a bearish retest
I also cover the monthly Morning Star and what levels would need the monthly to close above or below to be bullish or bearish.
As you know, I don't believe the bottom is in for the bear market. But bullish signals are building.
The Morning Star on the monthly is VERY significant especially with it forming at a former resistance possibly turned support
The problem here is that Bitcoin found resistance at the April 2025 low currently, something that didn't exist in 2022
In 2022, the Morning Star was part of a range deviation and reclaim. IMO, it was very obvious
This bottom is less obvious but that might mean anything
However, what does mean something is that these patterns PERFORM best when they arrive at the bottom of a downtrend, or during a bull market to continue an uptrend. The second chart shows this in the teal boxes
There was also a Morning Star on the monthly right before the COVID collapse
If we are potentially looking at another global economic event, this would make sense
I've long been expecting an X wave as part of a double zig zag